
In the world of relational databases, data is typically structured according to normalization principles. The goal is to reduce redundancy and enforce data integrity. This has long been the foundation of database design, especially when data is organized into the Third Normal Form (3NF) or even the Boyce-Codd Normal Form (BCNF). However, as data becomes more normalized, it also becomes less aligned with the format needed for reports, dashboards, and business intelligence applications.
Once you’ve connected to your data sources, located the relevant information, and created your dataset, the next crucial step is ensuring the accuracy of that data. It’s surprisingly common to discover that your dataset contains inaccuracies, duplicates, or what’s often referred to as “dirty” data. This is where Toad Data Point becomes an essential tool for data analysts.
In today’s application landscape, much of the data entry process is placed in the hands of end-users. Whether signing up for a website or completing an online form, users are frequently asked to provide personal details like email addresses, phone numbers, and postal codes. However, many users simply input random or incorrect information just to proceed. As a result, databases can quickly become populated with invalid, inconsistent, or misleading data.
As a data analyst, it’s your job to spot and clean up these issues. But how can you identify bad data quickly and efficiently?
When you’ve created a dataset in Toad Data Point, you can send that dataset to the Data Profiling module. The Data Profiling module helps you identify anomalies in your dataset. There are several components to it, as we will investigate below:
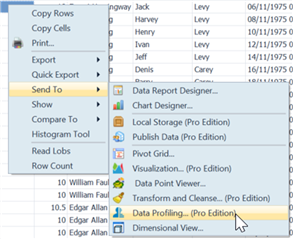
To send your dataset for profiling, right click on the dataset results then go to Send To | Data Profiling:
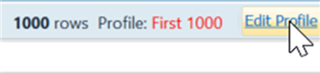
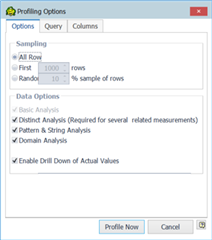
When Data Profiling launches, by default it will profile 1,000 rows. If you want to profile your entire dataset you can do so by clicking Edit Profile, then selecting All Rows:
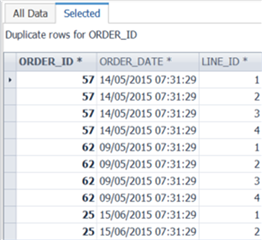
On the Summary tab, you will see a breakdown of each column visualized in a chart. The chart, as seen below, is very useful at identifying anomalies. In the example below, I was of the impression that OrderID is unique, but I can see there are non-unique and repeated rows. To see those repeated rows, I can simply double-click on the orange section of the OrderID bar, and the repeated rows will be listed for me.
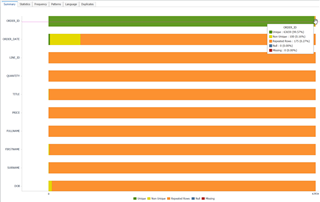
This shows up something interesting – the Order ID is correctly not always unique. To get the unique value of each row (Primary Key) I need to use OrderID + LineID.
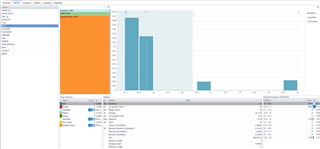
Moving to the Statistics tab – if you need statistical information about your data, then this tab is worth the license cost alone. Simply by selecting the column on the left panel, you will instantly get statistical analysis such as median, max, min, average, mode, quartiles, sum, standard deviation, etc. You can also quickly graph the Value Distribution and Percentiles for each column. In my opinion, the level of detail this tab gives you is really impressive. The time saved compared to calculating these values manually is significant.
The next tab I want to highlight is Patterns. Very simply, this looks at the patterns of the text/string columns in your data set. I see customers using this a lot for structured columns such as email address, post code, telephone number.
It will display the Word pattern (are letters, number, punctuation, spaces in use) and the Letter pattern (the order in which letters, numbers, punctuation, spaces are used).
In the example below, it clearly identified anomalies in my email address field, where I have email addresses that contain spaces, making them invalid.
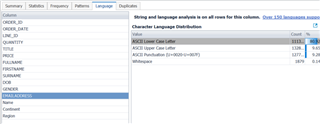
The Language tab offers similar information to the Pattern tab, this time detailing the character distribution used in text/string columns. Again, the email address is showing whitespaces in use.
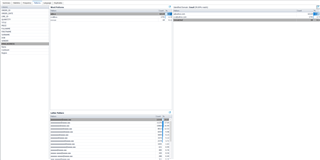
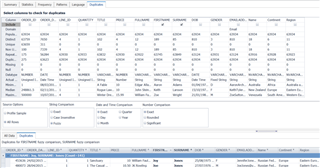
Finally, the Duplicates tab allows you to search for duplicates in the dataset. You simply select the columns you want to search, and it will search for duplicates across all the selected columns. In the below example I’m searching for Firstname and Surname duplicates. Since they are “string” columns, I’m selecting a fuzzy search. This tells the Toad to look for similar names, encapsulating potential spelling mistakes on data entry. The below screenshot highlights “Joy Jones” and “Joe Jones” as a potential fuzzy duplicate since there is only 1 character difference in their full name. However, I know this isn’t a duplicate, so I’ll add additional columns to make my search more refined.
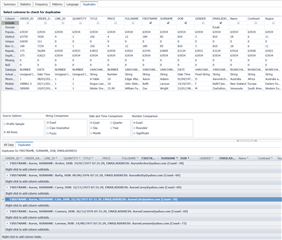
Below I’ve added “Date of Birth” and “Email Address”, which I’m confident will give me a unique person.
Having profiled my dataset, identified anomalies that I need to fix in the source application and/or revise my query, I can now proceed with confidence knowing that the data I’ve retrieved is accurate.
About DT Asia
DT Asia began in 2007 with a clear mission to build the market entry for various pioneering IT security solutions from the US, Europe and Israel.
Today, DT Asia is a regional, value-added distributor of cybersecurity solutions providing cutting-edge technologies to key government organisations and top private sector clients including global banks and Fortune 500 companies. We have offices and partners around the Asia Pacific to better understand the markets and deliver localised solutions.
How we help
If you need to know more about Toad Data Point: How do I know that my data is accurate, you’re in the right place, we’re here to help! DTA is Quest Software’s distributor, especially in Singapore and Asia, our technicians have deep experience on the product and relevant technologies you can always trust, we provide this product’s turnkey solutions, including consultation, deployment, and maintenance service.
Click here and here and here to know more: https://dtasiagroup.com/quest/